How Journium Works
Discover how Journium transforms application events into AI-powered insights. Learn about event collection, tracker configuration, job execution, and insight generation.
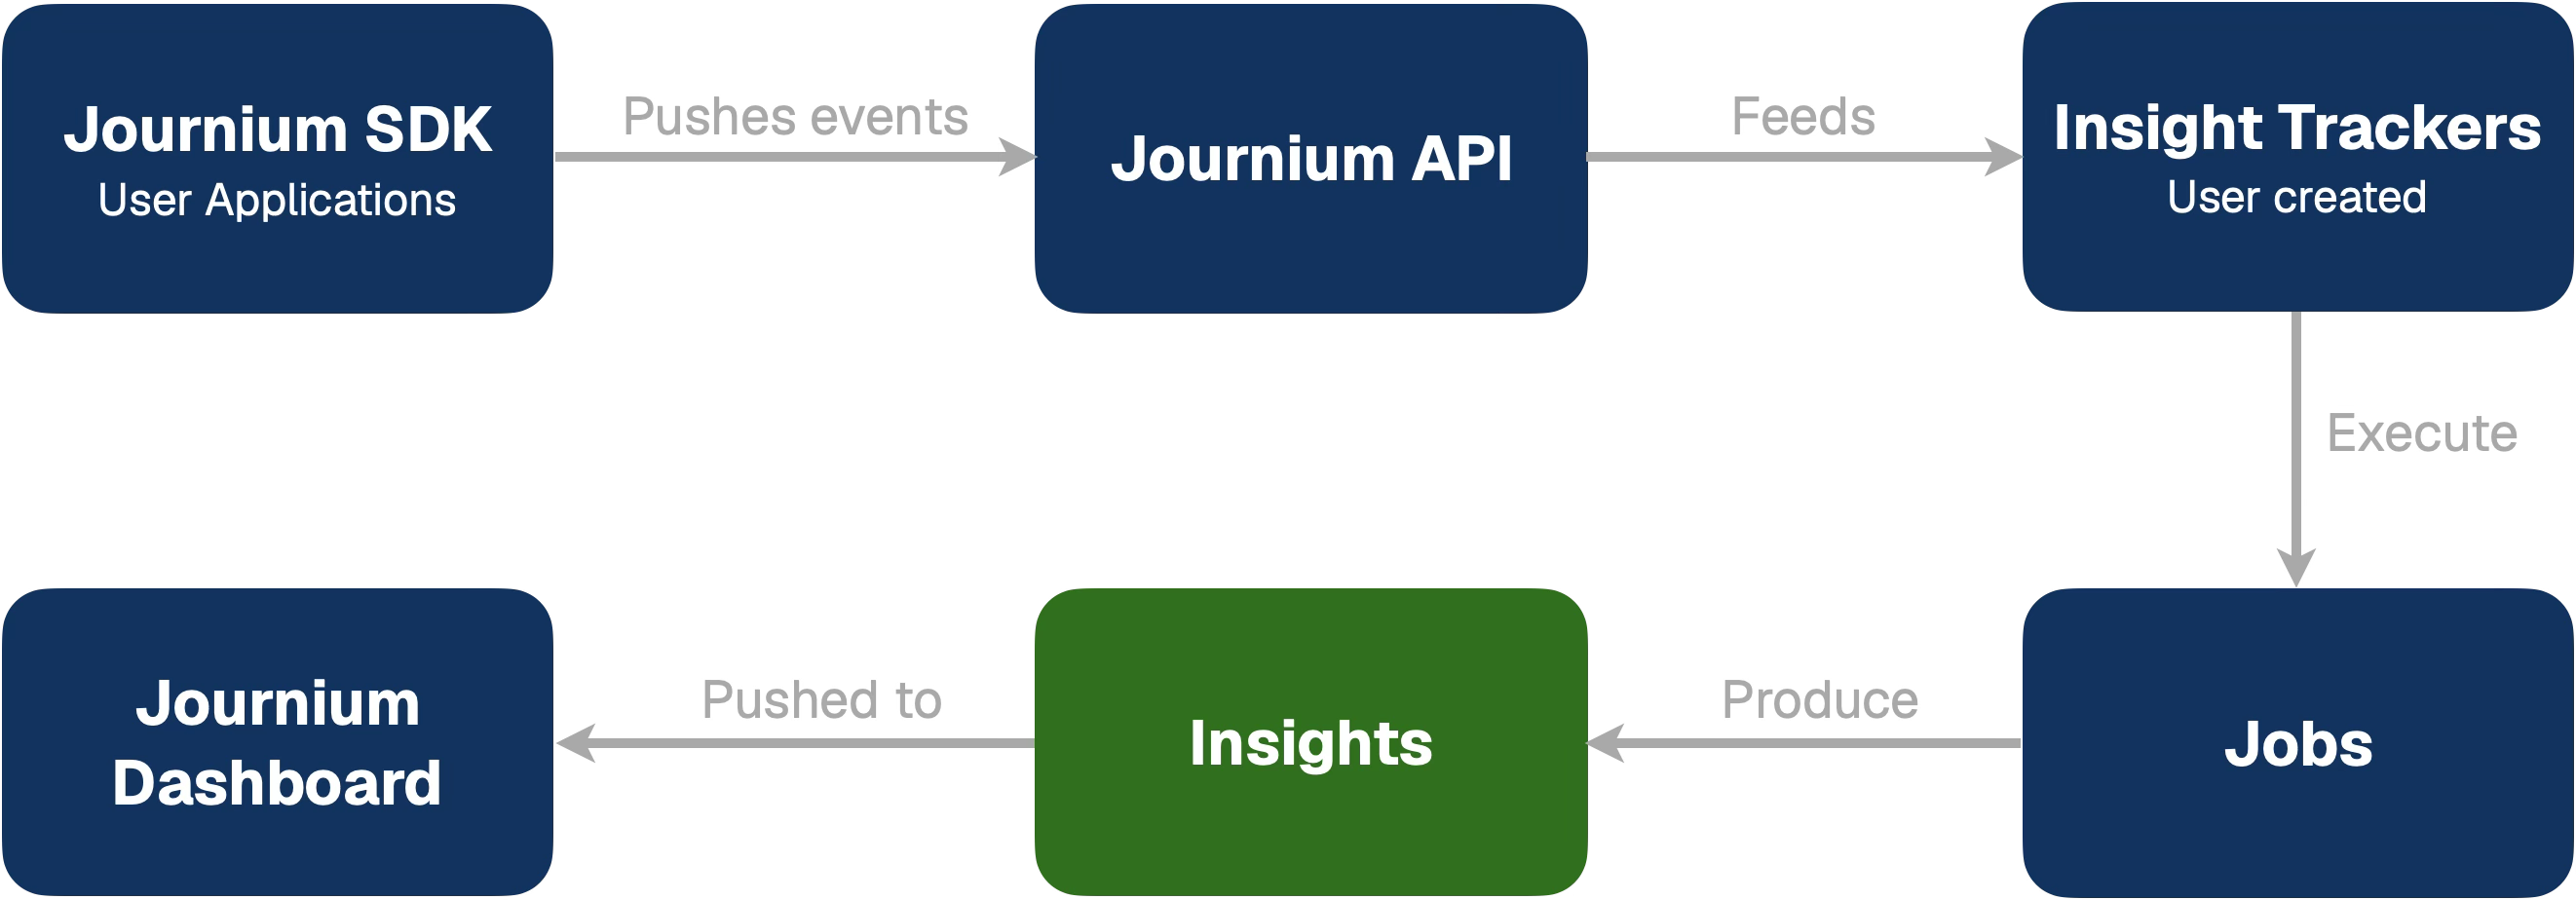
Journium works by collecting Events from your application and then using AI to generate insights from those events. Users integrate the Journium SDK into their applications, which sends events to Journium's API where they are ingested and processed. Users then create Insight Trackers that define the mechanics around how Insights should be generated, and Jobs execute those trackers to produce insights. These insights are then available on the Journium dashboard for users to view and analyze.
Journium Workflow
The diagram below illustrates the complete Journium workflow:
Event Collection
Event collection is the foundation of Journium's analytics pipeline. Users integrate the Journium SDK into their applications, which acts as a lightweight client library that captures user interactions and application events. When events occur in your application—such as user signups, purchases, feature usage, or errors—the SDK automatically sends these events to Journium's API endpoint. The API receives and ingests these events, storing them in a time-series database optimized for analytics queries. This continuous stream of event data provides the raw material that powers all subsequent analysis and insight generation.
Tracker Definition
Trackers are declarative configurations that define what should be analyzed and how insights should be generated. Users create trackers through the Journium dashboard, specifying which events to monitor (or analyzing all events), setting custom instructions for the AI analysis, and configuring execution schedules. Each tracker acts like a continuous data analyst that monitors specific patterns in your event data. Trackers can be set to run automatically on a schedule (e.g., hourly, daily, weekly) or triggered manually for ad-hoc analysis. The tracker configuration includes parameters such as the maximum number of events to analyze, custom AI instructions that guide the analysis focus, and the specific event types to consider. This "Insights as Code" approach allows users to define what they want to know about their application without writing SQL queries or building dashboards.
Job Execution
Job execution is the automated process that runs trackers and generates insights. When a tracker is scheduled to run or manually triggered, Journium creates a job that executes the tracker's analysis workflow. The job execution follows a multi-step pipeline: it first validates the tracker configuration and checks data availability, then queries the event database to retrieve the relevant events based on the tracker's configuration. The job then uses AI to analyze the event data, looking for patterns, trends, anomalies, and correlations. The AI engine processes the data according to the tracker's instructions, synthesizing findings into concise, natural language insights that are typically 1-3 sentences long and backed by verifiable data. Finally, the job stores the generated insights and updates the execution history, making them ready for display in the dashboard.
Insights Display
Once insights are generated by job execution, they become available in the Journium dashboard for users to view and analyze. Insights are displayed in a feed format on the application instance's insights page, similar to a social media feed, where each insight appears as a card showing the analysis results, timestamp, and metadata. Users can interact with insights by liking them, adding comments for team collaboration, saving them for later reference, or sharing them with team members. The dashboard also provides features like pagination to browse through historical insights, filtering options, and the ability to see insight trends over time. This presentation format makes insights easily scannable and actionable, transforming raw event data into understandable narratives that help teams make data-driven decisions about their application.
How is this guide?
Last updated on